With 2018’s data in the review mirror, there’s no better time to review performance. While a full year is what’s generally expected from studies like this, we’ve prepared a 3-year study — spanning 2016-2018 — and focusing on Search Engine Marketing (SEM) performance in the automotive retail, automotive service and consumer sectors.
For comparison, we’ve benchmarked it against nationwide data recently reported by Wordstream, a pre-eminent SEM software company, which receives data directly from their clients’ AdWords accounts. There are many automotive ad agencies, but the following results demonstrate our continued successes.
ABOUT OUR DATA:
- It’s comprised of campaigns executed in all 48 Continental United States
- It contains a large portion of data from Florida specifically
- The vast majority of campaigns were on behalf of premium consumer retail clients, spanning automotive retail and service, luxury goods, premium home appliances and more
- It does not contain eCommerce data
In publishing a full 3-year trend report, our goal is to provide a thorough picture of how consumer marketing through SEM has evolved over the years — and of course, how we’ve performed compared to industry benchmarks. So, without any further ado…
Table of Contents and Hot Links
- Nationwide Automotive Benchmarks
- Nationwide Automotive Service & Repair Benchmarks
- Nationwide Consumer Marketing Benchmarks
- Lincoln Digital Group 2016-2018 Conversion Trend
- Automotive Marketing by Distance (eg. 0-15 miles)
- Automotive Brand Benchmarks, 2016-2018
Nationwide Benchmarks and Our 2018 Performance
For our study, we are benchmarking against full year 2018 SEM data collected and provided by Wordstream. Wordstream is a renowned company and maker of SEM-optimization software tools. It collects its data directly from the Google AdWords accounts of its users, which means there is no opportunity for a user to fudge or obscure the data that is collected to establish these benchmarks.
Here are the 2018 full year benchmark totals for the industries covered in this study:
A. Automotive Retail
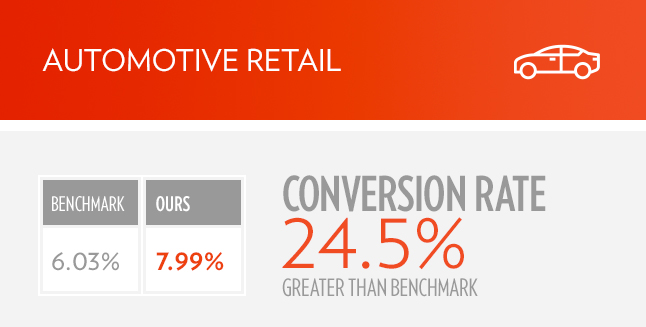
- 2018 Benchmark Conversion rate – 6.03% | Our result – 7.99%, 24.5% greater than benchmark
B. Automotive Service / Repair (Benchmark Data Here)
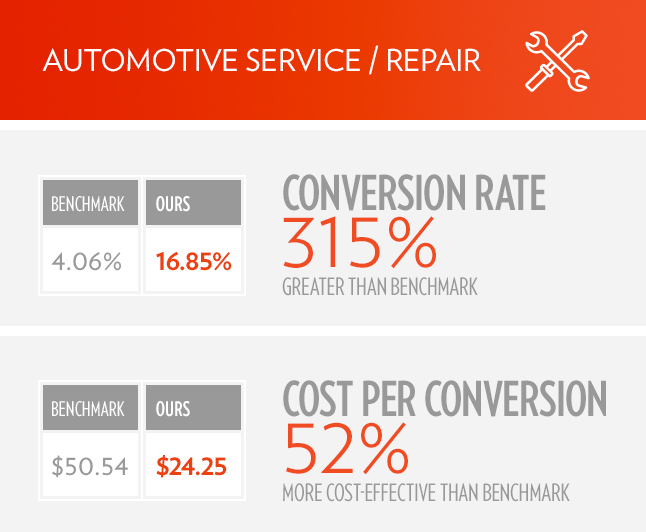
- 2018 Benchmark Conversion rate – 4.06% | Our result – 16.85%, 315% greater than benchmark
- 2018 Benchmark Cost per conversion – $50.54 | Our result – $24.25, 52% more cost-effective than benchmark
C. Consumer
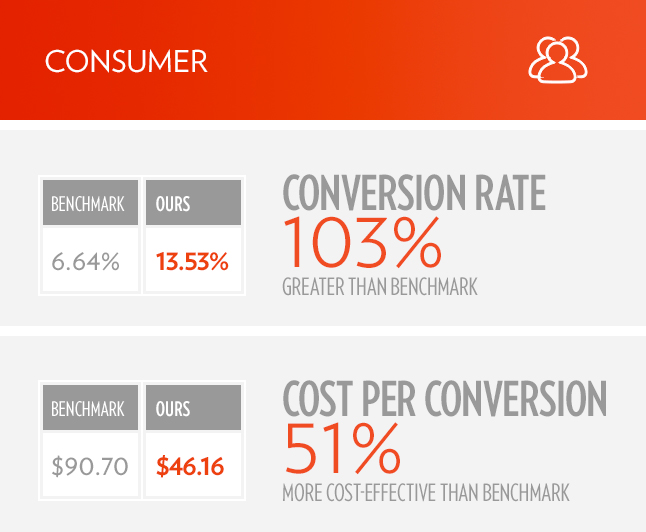
- 2018 Benchmark Conversion rate – 6.64% | Our result – 13.53%, 103% greater than benchmark
- 2018 Benchmark Cost per conversion – $90.70 | Our result – $46.16, 51% more cost-effective than benchmark
Our Full 3-Year Performance Comparison: 2018 vs. 2017 vs. 2016
While benchmark data is useful, we also believe it’s important to benchmark ourselves so we can review how our own performance has been trending over the past 3 years.
Due to enhancements in philosophy, talent and data-mining, we’re pleased to share that 2017 and 2018 not only improved significantly upon 2016, but handedly out-performed benchmarks in the 3 sectors that this study is focused on: Automotive Retail, Automotive Service & Repair and Consumer.
Here are our results:
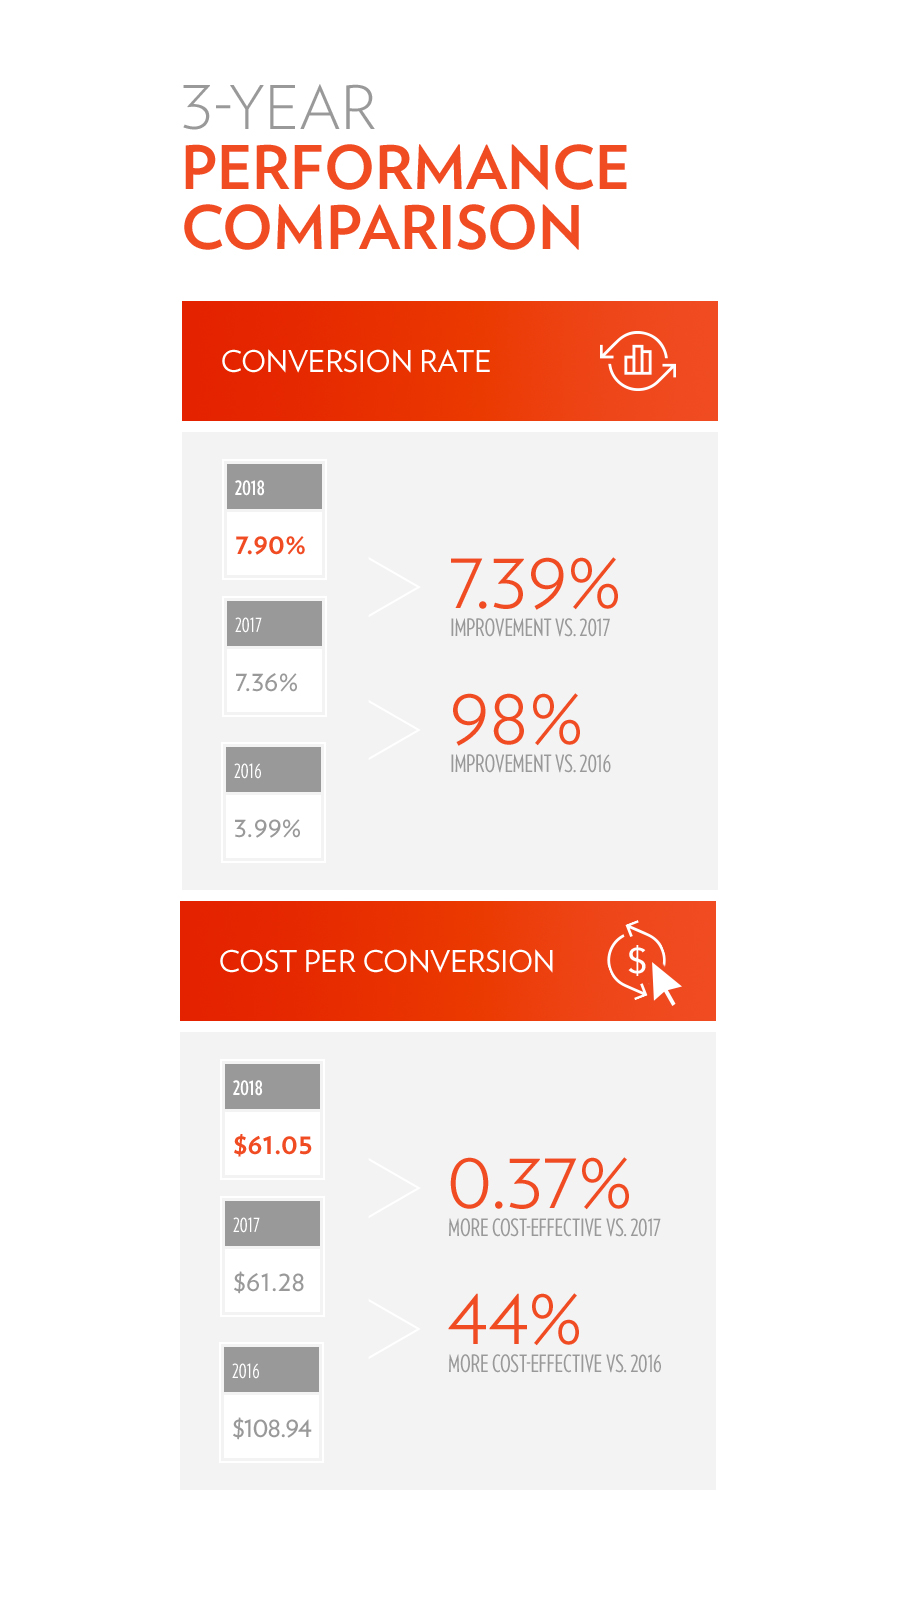
- 2018 Conversion Rate: 7.90% vs. 7.36% (2017) vs. 3.99% (2016)
- 7.39% improvement vs. 2017
- 98% improvement vs. 2016
- 2018 Cost per Conversion: $61.05 vs. $61.28 (2017) vs. $108.94 (2016)
- 0.37% more cost-effective vs. 2017
- 44% more cost-effective vs. 2016
Automotive SEM Data: Top Brands, PMA vs. non-PMA Marketing and Total Performance vs. Benchmark
There’s frequent discussion within automotive marketing circles about “how far is too far?” when it comes to digital campaign radius, and the cost of PMA vs. non-PMA marketing.
You’ll likely find the difference between cost and performance inside and outside of 15 miles from a given dealership’s rooftop to be eye-opening.
And while there’s been a lot of conjecture and “opinion” given on this topic, we’re pleased to be able to shed light on that topic, based upon 3 years of hard facts. You’ll likely find the difference between cost and performance inside and outside of 15 miles from your rooftop to be eye-opening.
We’ve consistently believed that a dealer’s PMA — and more accurately, a 15 mile radius from their rooftop — is absolutely essential to win if you want to be successful overall.
Our Automotive Search Engine Marketing Performance within 15 Miles
- 2018 conversion rate 9.85% vs. 9.53% (2017) vs. 5.93% (2016)
- 2018 cost per conversion rate $55.42 vs. $50.15 (2017) vs. 71.85 (2016)
- Averages, 2016-2018: 8.69% conversion rate & $57.53 cost per conversion
Our Automotive Search Engine Marketing Performance within Outside of 15 Miles
- 2018 conversion rate 3.22% vs. 3.82% (2017) vs. 3.07% (2016)
- 2018 cost per conversion $168.40 vs. $121.45 (2017) vs. 150.96 (2016)
- Averages, 2016-2018: 3.93% conversion rate & $126.88 cost per conversion
2016-2018 Average Totals, Inside 15 miles vs. Outside 15 miles
- Conversion rate: 55% better inside 15 miles
- Cost per conversion: 54.7% more cost-effective inside 15 miles
Automotive SEM Benchmarks by Make: Our 2016-2018 Performance
One data set we’re frequently asked for is performance benchmarks by automotive Make. While much of this dependent upon each market’s competitive and geographic landscape, below is a 3-year average based upon brands with large scale data in major metro areas:
- BMW 9.12%, $65.24
- VW 7.06%, $70.89
- Audi 6.16%, $89.80
As you can see, Lincoln Digital Group conversion rate figures all significantly out-perform the nationwide automotive benchmarks.
How Does Your Digital Marketing and SEM Conversion Performance Compare?
Now that you know the 2018 national SEM conversion benchmarks — along with the greater performance that is possible with the right partner — chances are you’re much more informed about your business’ digital marketing campaigns.
So, how does your business stack up? Are you beating national benchmarks for your industry, or are they beating you?
Are you paying more than necessary for leads, or is your dollar going farther than the average?
And importantly, how are your campaigns trending over the past few years? Are your conversion metrics consistently improving — or at least holding costs consistent? Or, do your metrics indicate a choppy ride that you want to avoid another year of?
We believe these are questions you need to ask yourself as you review your most recent years of campaign performance vs. both national benchmarks as well as our own data.
The data is out there. The question is: What will do you with it now?
To learn more about this study or receive an expert assessment on your conversion effectiveness, contact Lincoln Digital Group today.


