With the first quarter of 2019 officially in the books, there’s no better time to compare and analyze year over year performance.
As we did in publishing our 3-year automotive and consumer SEM conversion study in January of this year, we’ll be comparing the following data points to spotlight comparative year over year performance:
-
Lincoln Digital Group Q1 2019 automotive SEM data vs. Q1 2018 automotive SEM data
-
Lincoln Digital Group Q1 2019 automotive SEM data vs. Q1 2019 National automotive SEM benchmarks*
-
Lincoln Digital Group previous 3 years’ Q1 automotive SEM data
-
Lincoln Digital Group Q1 2019 automotive SEM data PMA vs. non-PMA performance
-
Lincoln Digital Group Q1 2019 automotive SEM top performing Makes
ABOUT OUR DATA:
-
Due to growth of available information, this Q1 2019 data set includes performance related to Land Rover and Mercedes-Benz dealerships; 2018 data does not
-
It contains a large portion of data from Florida specifically
-
It does not contain eCommerce data
Our Automotive Search Engine Marketing Performance: Q1 2019 vs. 2018, and vs. National Benchmarks
-
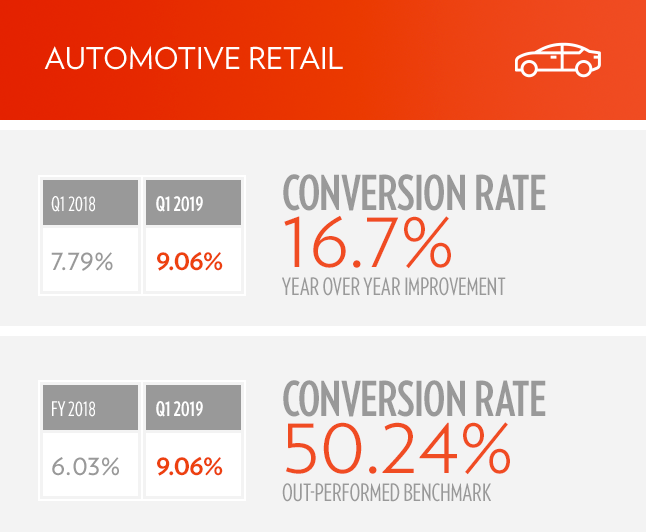
Lincoln Digital Group Automotive SEM conversion rates: 9.06% (2019) vs. 7.79% (2018)
-
+16.7% YoY improvement
-
-
Lincoln Digital Group Q1 2019 SEM conversion rates: 9.06% vs. 6.03% (FY 2018) national automotive benchmarks
-
+50.24% out-performance vs. benchmark
-
Our Automotive Search Engine Marketing Performance: Past 3 Years’ Q1 Results
-
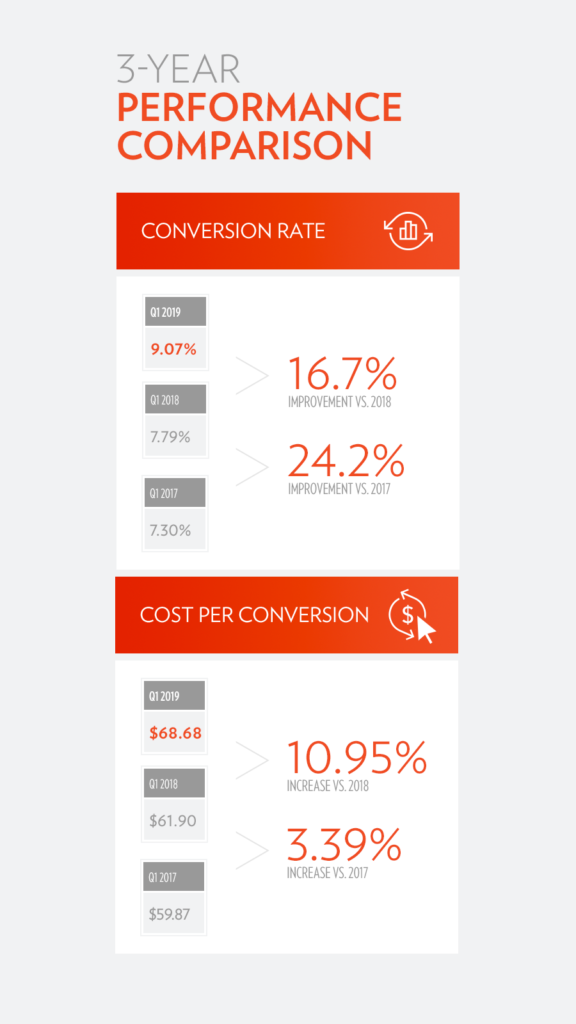
2019 conversion rate 9.07% vs. 7.79% (2018) vs. 7.30% (2017)
-
+16.7% 2019 vs. 2018
-
+24.2% 2019 vs. 2017
-
-
2019 cost per conversion $68.68 vs. $61.90 (2018) vs. $59.87 (2017)
Our Automotive Search Engine Marketing Performance within 15 Miles
-
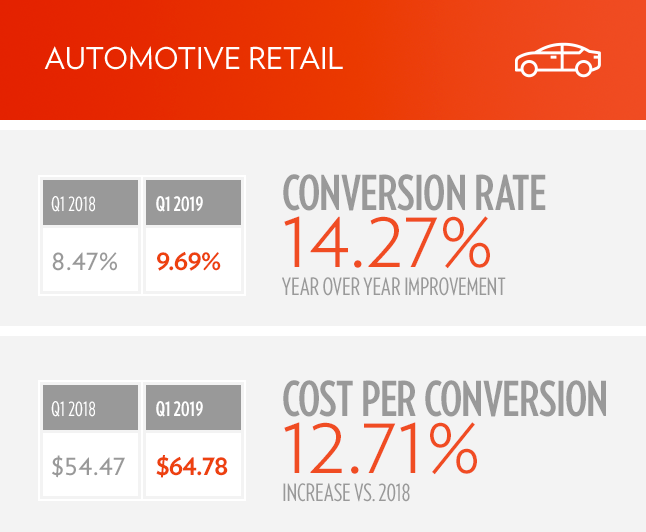
2019 conversion rate 9.69% vs. 8.47% (2018), a 14.27% increase
-
2019 cost per conversion $64.78 vs. $57.47 (2018), a 12.71% increase
Our Automotive Search Engine Marketing Performance within Outside of 15 Miles
-
2019 conversion rate 2.99% vs. 3.25% (2018), a 7.85% decrease
-
2019 cost per conversion $190. vs. $139.65 (2018), a 36.16% increase
2019 Q1 Average Totals, Inside 15 miles vs. Outside 15 miles
-
Conversion rate: 69% better inside 15 miles
-
Cost per conversion: 66% more cost-effective inside 15 miles
Top Performing Automotive Makes for Q1 2019
-
Mercedes-Benz
-
Conversion Rate: 18.04%
-
Cost per Conversion: $52.75
-
-
BMW
-
Conversion Rate: 9.76%
-
Cost per Conversion: $66.41
-
-
Audi
-
Conversion Rate: 7.69%
-
Cost per Conversion: $76.42
-
*As published by Wordstream
Costs Slightly Rise, but Conversion Rate Outperforms; Backyard Dominance Remains Imperative
In conclusion, our Q1 2019 findings show that while costs have risen slightly compared to previous First Quarters, conversion rates continue to substantially outperform both the national benchmarks, as well as the smaller increases in cost. In other words, although costs have risen Q1 vs. Q1, the percentage increase of conversion rate is greater than the cost increase of each conversion — indicating greater proficiency at generating leads from SEM.
Additionally, the Q1 over Q1 changes in SEM campaign performance in PMA — or, backyard — areas continue to indicate that the immediate 15 miles surrounding dealers’ rooftops is exponentially more fruitful and cost effective than campaigns outside of 15 miles. The 69 percent difference in conversion rate, as well as the 66 percent difference in cost, from within 15 miles to outside of 15 miles is not only a greater percentage spread than all of 2018 vs. 2017, but also indicates the importance of a dealer’s backyard will continue to grow relative to areas outside of it.
With this information in-hand, we believe the time is ripe to begin optimizing your automotive SEM campaigns for the quarters ahead. Be sure to compare your dealership’s data versus national benchmarks, and to continually be reviewing all of the essential SEM campaign metrics when implementing your changes.
As always, feel free to contact us for any assistance.

