Palm Beach County Digital Consumer Report · Fall 2026
Eight findings from 90 days of local data, and the marketing actions we recommend in regards to each one.
We pooled 90 days of anonymized data from businesses we work with in healthcare, hospitality, retail, real estate and the nonprofit world. A pattern in one business’s data might just be that business. When the same pattern shows up in a medical practice’s search traffic and a florist’s Instagram, it says something about the county.
Most of what gets said about Palm Beach County consumers is inherited wisdom. It’s a retirement market. People shop on weekends and browse in the evening. The best star rating wins. We checked those assumptions against what local customers actually did, and several don’t hold up.
1. The county is younger than its reputation.
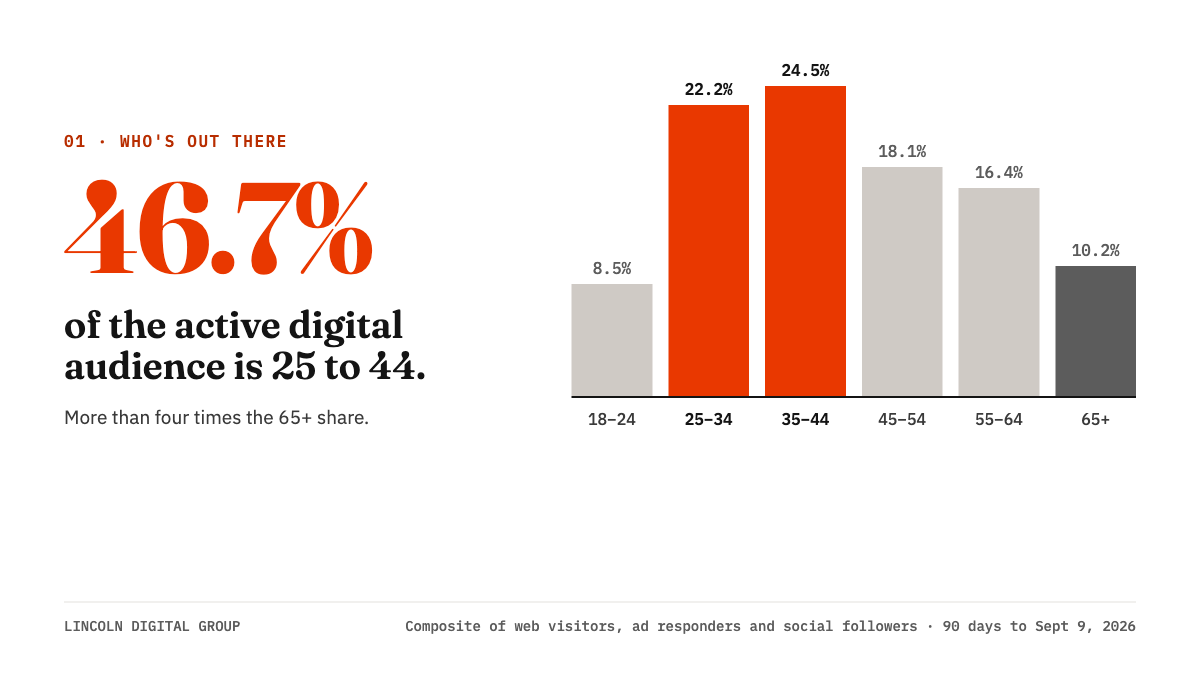
46.7% of the active digital audience is 25 to 44. Only 10.2% is 65 or older.
Palm Beach County is sold, and sold to, as a place people retire. We compared three audiences that were never designed to agree: website visitors, people who responded to paid ads, and social followers. They agree anyway. Roughly seven in ten are women, and nearly half fall in a single 20-year band, 25 to 44. That’s more than four times the 65+ share.
What to do with it: If your casting, tone and offers are built for retirees, you’re probably aiming a decade or two older than most of the people actually looking. Default new creative to a 30–44 lead persona unless your product really does skew older.
2. It researches Tuesday, decides midweek and shows up Saturday.
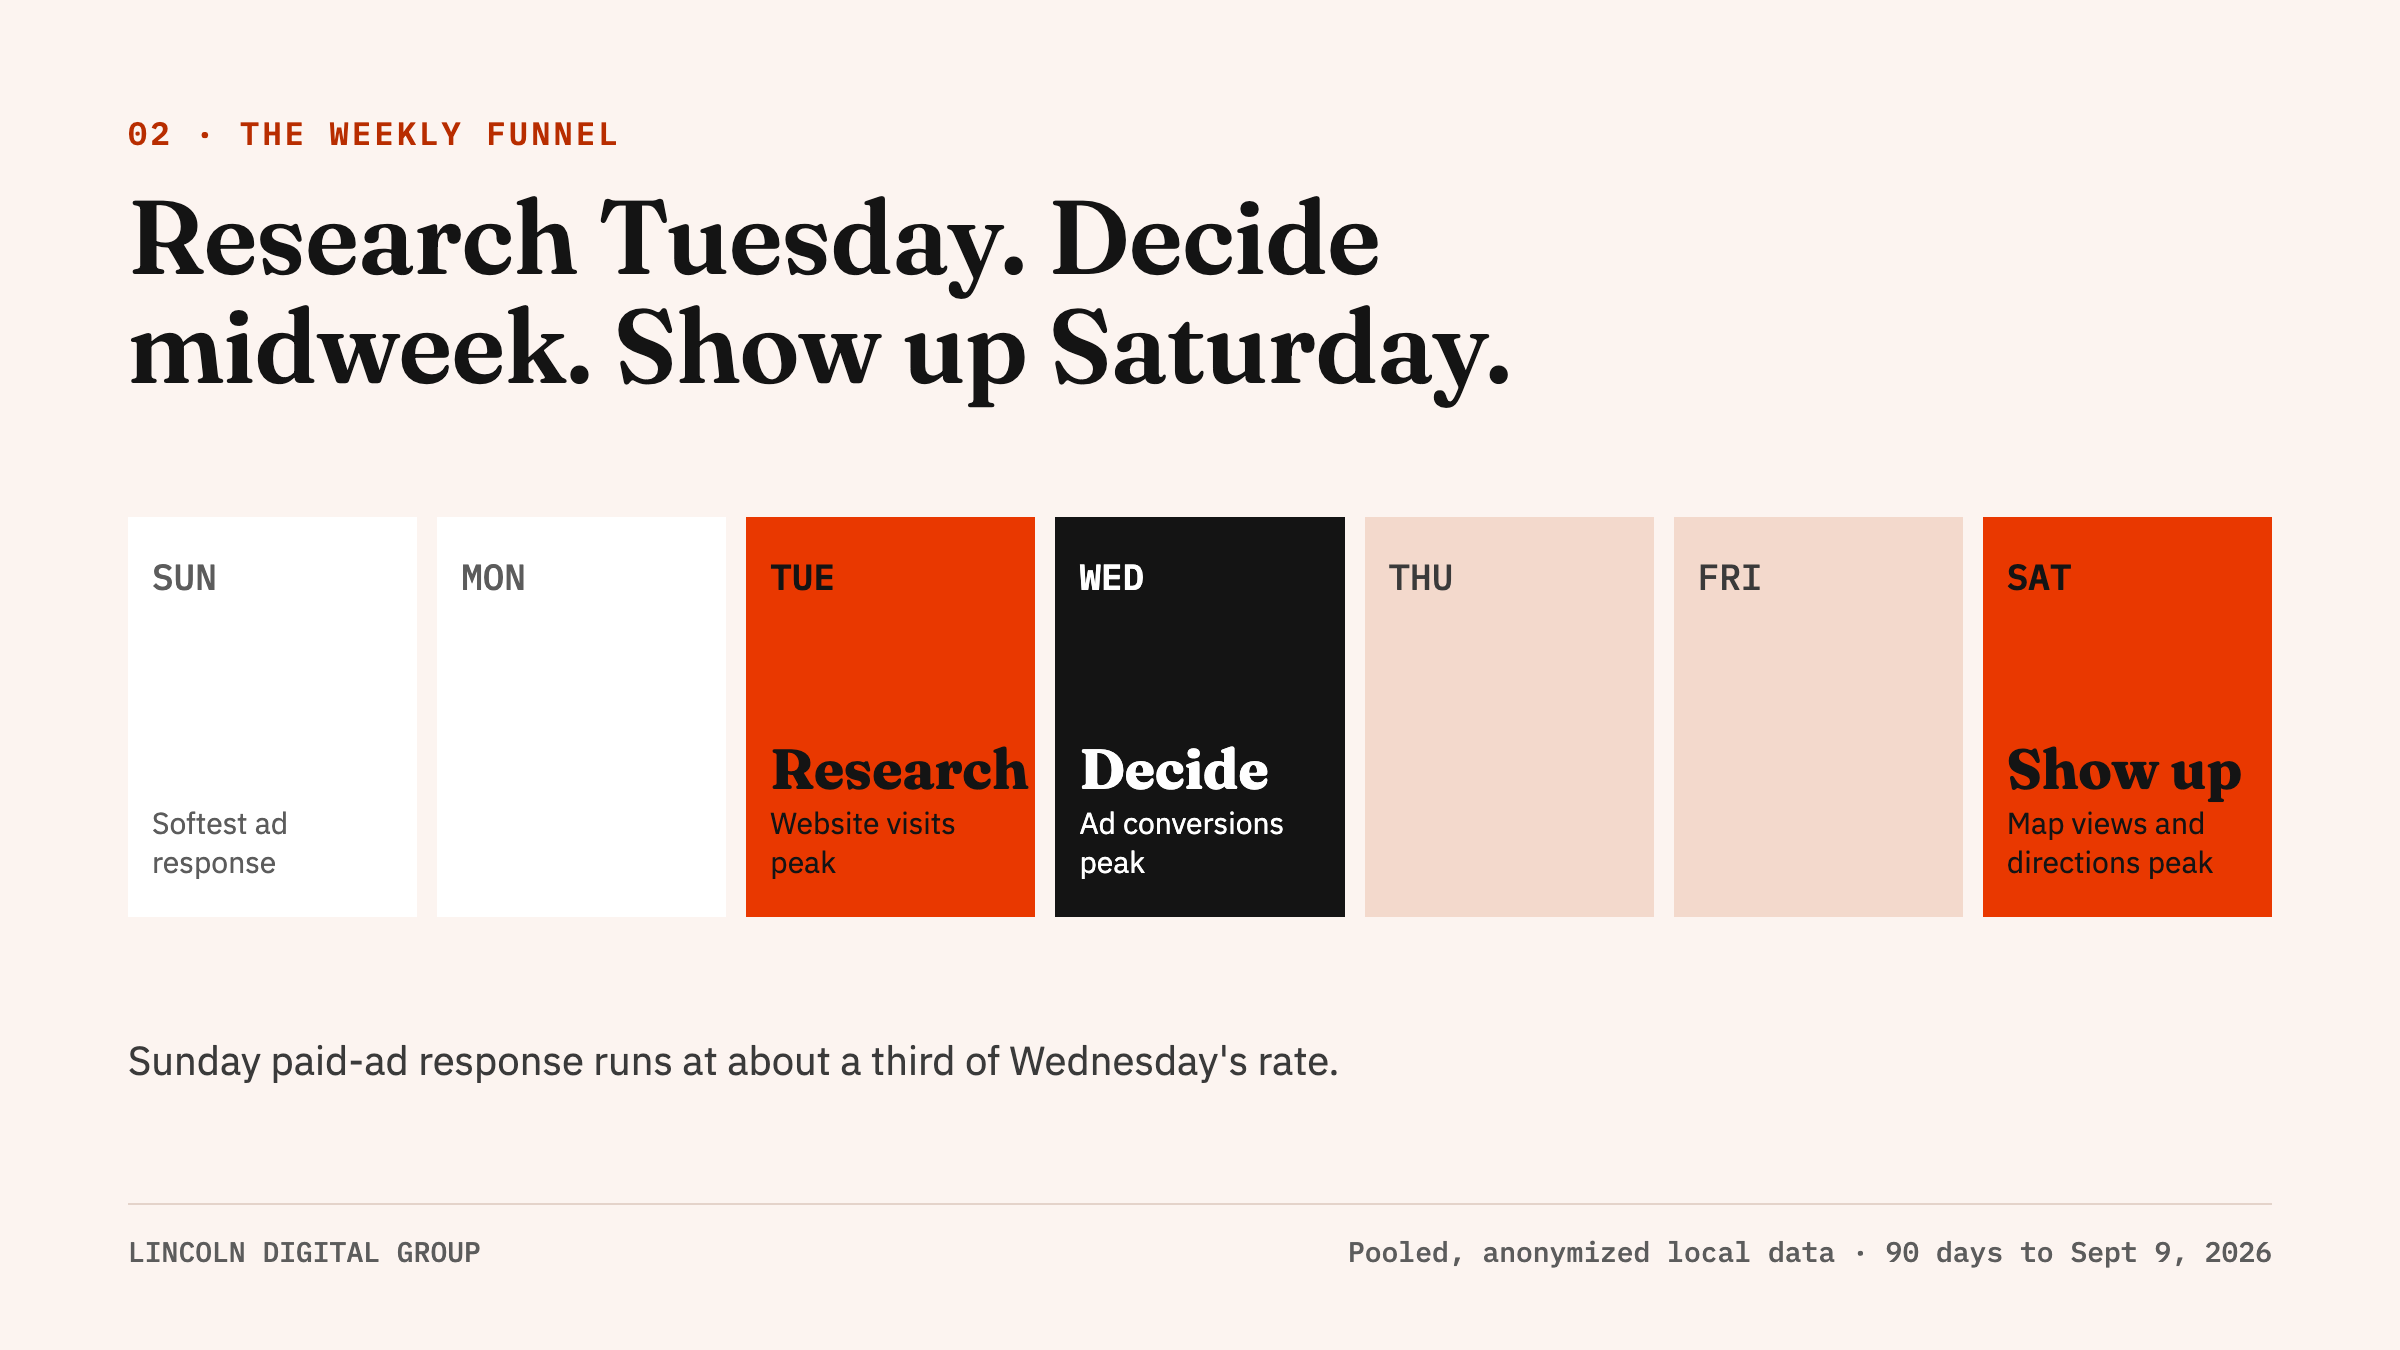
Website visits peak on Tuesday. Paid-ad conversions peak on Wednesday, with the rest of the work week close behind. Google Business Profile views and requests for driving directions peak on Saturday. Those three signals were never coordinated, yet they line up in order like a funnel. Weekends are the weak spot for ad response: Sunday converts at about a third of Wednesday’s rate.
What to do with it: Publish new content before Tuesday. Pace paid budget toward midweek, not the weekend. Time local offers, SMS and review requests around Saturday, when people are physically in your door.
3. It’s a lunch-hour county, not an evening one.
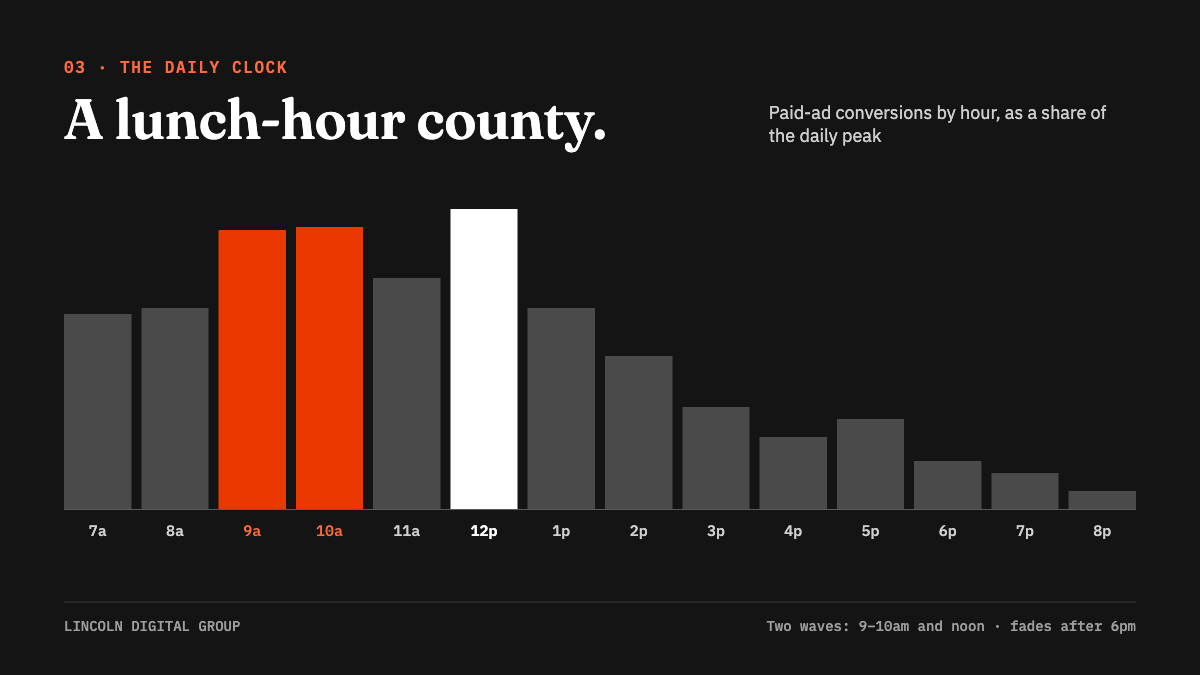
Ad conversions don’t build toward the evening the way national retail calendars assume. They come in two waves: a surge at 9 and 10am, a dip at 11, and the day’s real high at noon. Volume holds into early afternoon and falls away after 6pm.
What to do with it: Schedule ads, SMS and posts in two midday waves instead of one late-afternoon blast. Stop defaulting to the 6–9pm slot that most templates ship with.
4. The Importance of Brand: Our County searches by place, not by category.
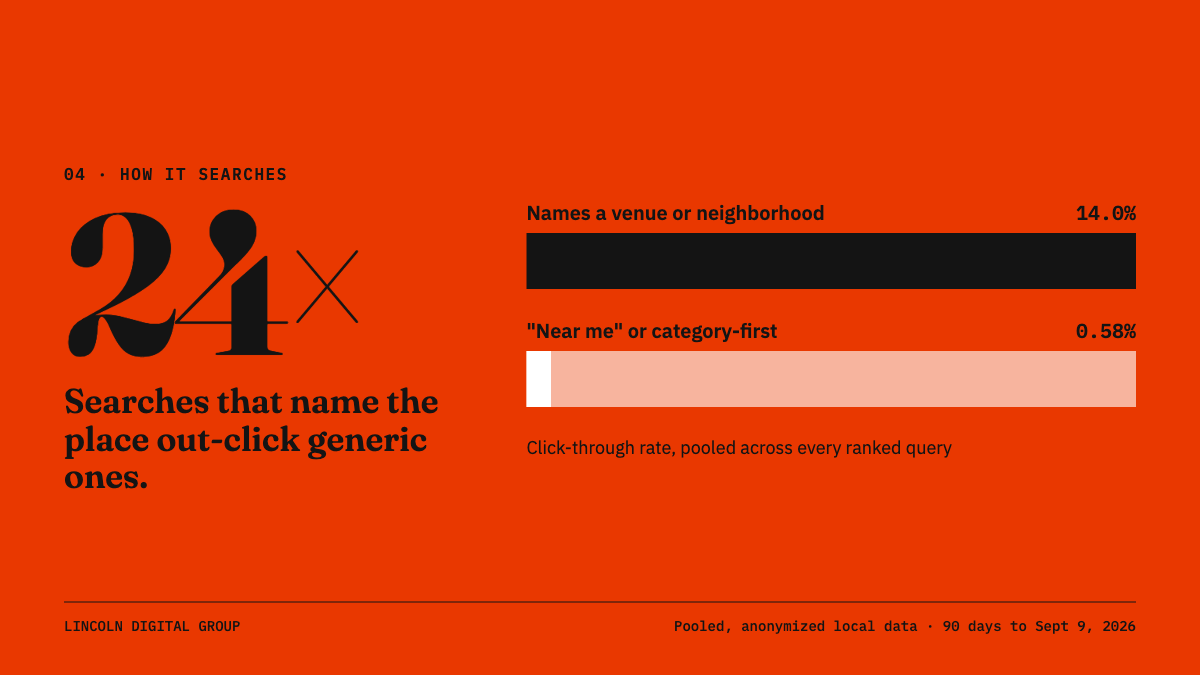
24× higher click-through when the search already names the place: 14.0% versus 0.58%.
Searches that already include a venue or neighborhood name get clicked about one time in seven. Generic, category-first searches get clicked fewer than one time in 170. Those are the “near me” and “best [category]” terms most SEO plans are built to chase. Meanwhile, searches that pair a venue with a neighborhood already rank at the top. Locals think in place names, and Google has noticed.
What to do with it: Put the neighborhood or venue name in the page title, the headline and the first sentence. Category terms can come along as a secondary target, but they shouldn’t lead.
5. Stars are table stakes. Review count is the gap.
8× spread in review volume between similar locations with near-identical ratings.
Every rated location we measured sits between 4.5 and 4.9 stars. Nobody is losing business on perceived quality, because the ratings all say “good.” What does vary is review volume, by as much as eight to one between otherwise similar locations. In a crowded map listing, the review count is what a shopper notices first. Across the locations we track, review volume grew about 90% year over year while the average rating stayed flat.
For outside context, a 2026 BGR Review study of 1,485 local businesses found that most categories need roughly 30 to 50 reviews before a profile performs consistently. It also found that a 4.5-star profile with hundreds of reviews reads as safer to shoppers than a 4.8 built on a handful.
What to do with it: Ask for the review while people are already there in person, during that Saturday peak. Automate the follow-up, and track review count every month, not just the star average.
6. Phones find you. Desks often close the deal.
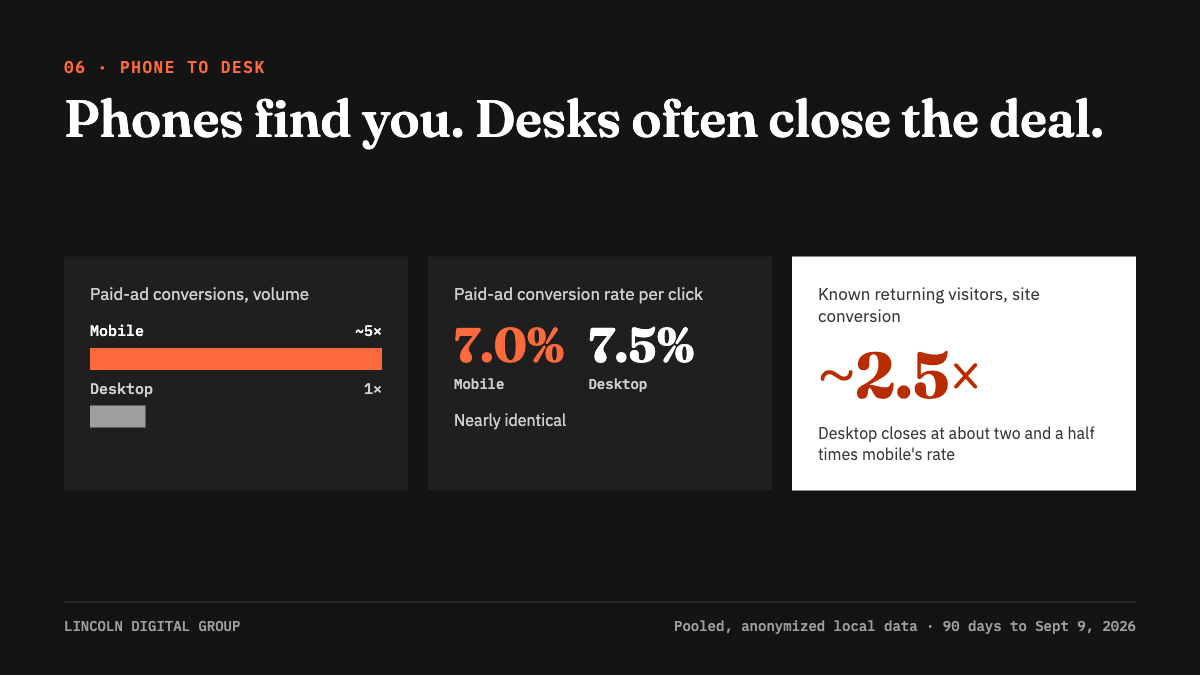
About 5:1 mobile to desktop in paid-ad conversion volume, with a nearly identical conversion rate per click.
Mobile produced roughly five times as many paid-ad conversions as desktop, but the two converted clicks at almost the same rate: 7.0% on mobile versus 7.5% on desktop. The difference comes from how many people each device reaches, not from how well it persuades them. Among known, returning website visitors, the picture flips: desktop closes at about two and a half times mobile’s rate. For anything people think hard about, the journey starts on a phone and often finishes at a desk.
What to do with it: For healthcare, real estate and other considered purchases, capture the visit on mobile and follow up on desktop. Cross-device remarketing beats optimizing either device on its own.
7. Men and women click alike. Women follow through.
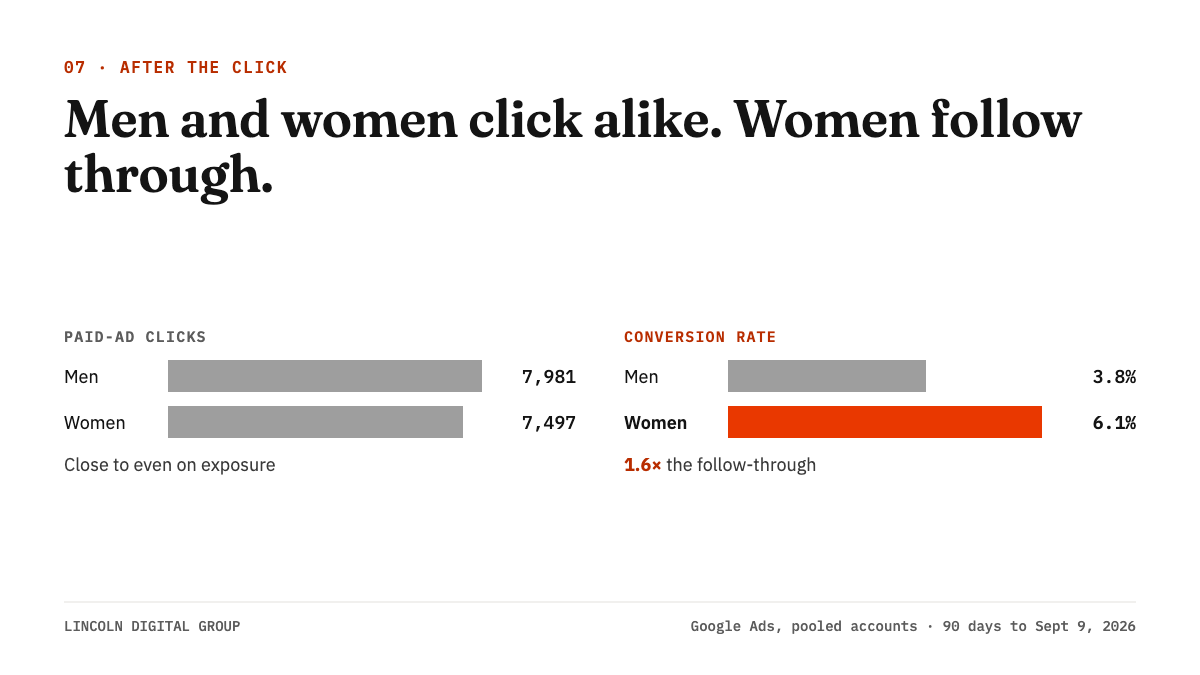
Women convert on paid ads at 1.6× the rate men do: 6.1% against 3.8%.
Men actually generated slightly more ad clicks than women, at a slightly lower cost per click. On raw exposure, the two audiences are close to even. What happens after the click isn’t. Once someone is already on the site on a desktop, the gap mostly disappears. That makes this a difference in how people respond to paid ads, not a problem with the website.
What to do with it: If budget follows click volume, it quietly leans toward the audience less likely to act. Test creative and offers against women 25–44 first, and watch your blended cost per acquisition.
8. Growth is real, but may be cooling.
Website sessions ran 12% ahead of last year over the 90 days. But growth built through the winter, peaked in March and has largely slowed since, to +9% by August. Search tells a sharper story. Impressions and clicks are both down from a year ago, even though average ranking improved by about nine positions. Click-through also dipped early this year, which is the pattern you’d expect as more questions get answered on the results page before anyone clicks. On Instagram, reach fell 23% while profile visits roughly doubled. The audience is smaller but more curious.
What to do with it: Don’t set Q4 targets off spring’s numbers. Measure what happens after the tap, not just reach. And watch your search click-through month to month, because AI answers are changing what a ranking is worth.
Where does your business sit?
These are county-level patterns. Some businesses already beat them; others are leaving money on the table. Here’s a three-point check you can run on your own accounts:
- Time your spend to the county’s rhythm. Pull your conversions by day and hour. Is your budget weighted toward midweek middays, or spread flat and loaded toward evenings and weekends?
- Count your reviews, not your stars. Are you under 30 to 50 Google reviews, or adding them more slowly than competitors? If so, fixing that will do more for you than anything on the page.
- Give every ad format the right job. In our data, Performance Max converted at roughly a sixth the cost of standard Search. Is each format in your mix doing the job it’s best at? That means Search and Performance Max for response, and display and video for building the reputation that makes those clicks happen.
Want us to run the check with you?
We’ll put your own numbers next to the county’s in a 20-minute working session. We’ll tell you plainly where you’re ahead, where you’re behind and what we’d change first.
About LINCOLN DIGITAL™
Lincoln Digital has been building businesses in Palm Beach County since 2013. We’re builders of businesses who happen to use marketing as our primary instrument, and our purpose is simple: to help great businesses grow their positive impact. Reports like this one are how we stay Masters of the Consumer Market.
How we did this
This report pools anonymized data from Palm Beach County businesses LDG works with, across five industries. Sources were website analytics, Search Console, Google Business Profile, Google Ads and Instagram. The window is the 90 days ending September 9, 2026, compared with the same period a year earlier where noted. No figure is attributed to any single business. We found that one account’s ad-conversion tracking was over-counting and corrected it before pooling. This is a cross-section of active local businesses, not a census of the county, so treat it as a strong directional signal. Outside benchmarks are cited separately and are not blended into our figures.