ACTUAL CHARTS, RESULTS & EXAMPLES FROM OUR PRESIDENT
In the following blog series, we’re going to walk you through both high-level and granular levels of reporting and what it means for your expense monitoring and channel performance tracking efforts. We will review dozens of SEM campaigns and the results they brought; likewise for international Facebook campaigns and display campaigns to various audiences throughout the United States and select worldwide markets individually.
We’ll endeavor to show you how to achieve a total marketing program cost per lead, by appropriately weighting and combining the relevant cost metrics.
We will show you how to isolate cost per lead down to the market, channel and individual ad unit combination. And we’ll also reveal some tips forimprovement.
This probably isn’t what you’re used to seeing (or hearing) from an agency, but we believe have nothing to hide. We believe in transparency. And we act on that belief through the level of reporting detail and dissection available in our dynamic web-based reporting tools. They can be pretty eye-opening, and we like to share them.
First, let’s begin with a glossary. You can’t grow what you don’t know, right?
About Lincoln Digital Group and Our Philosophy
We don’t believe in doing everything. Or doings thing just to do them. But in today’s day and age, almost everyone wants everything for the same price as one of things — and thrice as fast. We’re small and focused, yet leverage well in orderto operate a full-service model.
We pride ourselves on being nimble providers of high quality digital goods and results, and our thoughts and priorities are designed intently to help you fuel growth and focus on the big picture. Nothing more, nothing less.
We believe that in digital marketing, with limited resources that people all around the world need, businesses must choose what metrics or categories they’re going to be the leader in, and which simply aren’t as important.
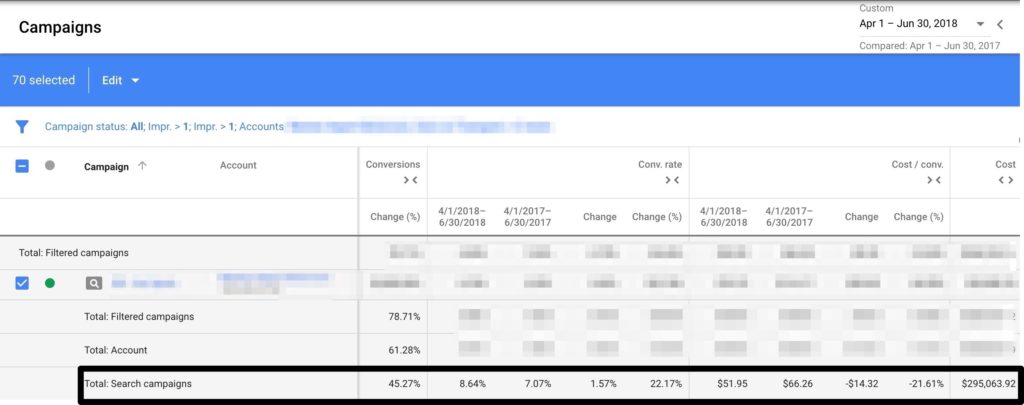
You may be wondering: who are these people, and why I should listen to their thoughts on digital marketing? I believe our team’s results speak for themselves:

*Image heavily blurred to protect unique identification and/or unnecessary disclosure.
What this Table Means for Ad Performance and Expenses
Year over year, we achieved an overall cost per lead decrease of 22 percent throughout Q2 in 2018.
Couple that performance with a 21 percent increase in conversion rate — the rate at which you convert visitors into leads (conversions) year over year —and you have the landscape for incredible prosperity from a digital lead-generation operation.
We also increased total conversions — not simply paid search conversions — by 61.28% year over year, across the board…and 45% for SEM conversions in particular.
We have delivered similarly impactful growth results for large businesses, the automotive industry andprominent brands throughout North, South and Central America since 2013 — when we first launched.
This Series, Your Benefits and Other, Future Content from LDG
Moving forward, we plan to post other case past and recent (blurred/redacted) results from our performance. We also plan to reflect upon unique results or challenges in mini-case studies, everywhere those opportunities present.
If we’re not proud to share it, that’s a sign to us in its own right.
By the time this initial mini-blog series is all said and done, you’ll know how to track and identify the costs and cost-effectiveness of each of your marketing channels.
You’ll also see how far each marketing dollar goes toward reaching certain audiences, and how each of those audiences may be different and should be cost-balanced accordingly.
It may even help you predict seasonal trends that we come close to repeating themselves time in and time out.
We look forward to helping you grow online. From good to great, medium to large, large to huge, our aim is to share real results for real learning. See you back here soon.
-Justin Cerone
President
Lincoln Digital Group

