
Before we get started, yes, this piece is about math. But trust us, don’t run away, because marketing statistics and understanding how some simple concepts impact your success go hand-in-hand. Right now, we’re all gearing up for our holiday marketing efforts, and whether you’re planning a Black Friday blowout or a cause-focused Christmas, you can better focus your efforts and understand your results by applying some important mathematical concepts as you execute and track your marketing plans. Here are our top 3 concepts that we think everyone should understand.
Deck the Halls with Data Points: The Importance of Sample Size in Marketing Statstics
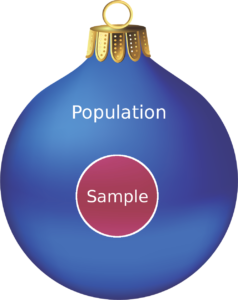
One of the most basic statistics used to describe a set of data is its sample size – and it’s exactly what it sounds like – it’s just the size of the sample. It may sound like a no-brainer, but sample size is extremely important when trying to discern good statistics from bad statistics. For instance, if you put up a holiday special on Facebook that gets a clickthrough rate of 90%, that sounds excellent – but if your Facebook page only has 10 followers, that result is much less significant. Always check the sample size and make sure you interpret your results accordingly!
On the other hand, when a sample size is too big, data can be difficult to work with. If you have a record of thousands of customers from over the years, and you want to do a survey for your Black Friday sale, polling all of them is going to prove difficult – so you use sampling to choose random samples of a few hundred. Generally speaking, a sample of 10% of a population is a pretty good start.
Merry Mean and Median
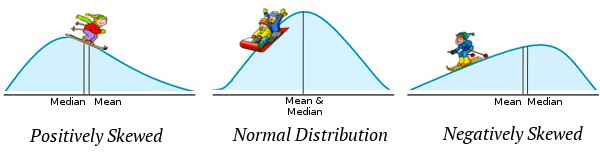
Mean and median are two important statistics which help to measure the “center” of a sample. The mean is what most non-stats folks call the average, and the median is just the middle point (as many data points above as below). These two measurements can have similar values, or they can vary based on how the data is distributed, and if you think about the concept in reverse, if you know the mean and median of a data set, it can help you to understand if your data set is skewed, and how it may be distributed.
Let’s talk examples. Let’s say you run a series display ads across your brand’s web presence for a holiday special. If those display ads have a mean engagement count of 300, and a median engagement count of 350, then one or two of your display ads may not be as visible. Here’s how that works: if two of your ads are hidden or hard to see, their engagement rates will be significantly lower than the rest – they will be outliers. Those outliers will pull your mean down a little, but the median is less affected by outliers, and shows a true “middle” point. If you’re paying attention to the mean and median, you’ll notice the discrepancy and move those less-visible ad spots to correct it.
More Marketing Statistics Aliteration: Correlation, Causation, and Other Reindeer Games
“Correlation, not causation” is a phrase you may have heard used before. Knowing the difference is a vital concept in statistics, and marketing, and life. Correlation happens when two or more variables in a statistical measure have a relationship with each other – for example, in vehicles, size and fuel economy are negatively correlated because usually, as size increases, fuel economy decreases. However, the size is not necessarily the cause of the fuel economy decrease. There are many factors which affect fuel economy, so this is an example of a correlation but not causation.
It’s very important to understand these concepts so that you can interpret your marketing results accurately. For instance – let’s say you’re running your holiday banner ad campaign in the week leading up to your Black Friday sale. On Black Friday, you see lots of traffic at your site and your business has plenty of customers. However – those customers could have come from your Facebook page if it was also mentioning your Black Friday sale, and many could simply be regular Black Friday shoppers. A good understanding of these simple statistical concepts will go a long way to helping you not only understand your marketing efforts, but also improve them.
Here at Lincoln Digital Group, we speak “big data.” Our expert marketing team not only understands how to create beautiful and effective marketing campaigns, but we also comprehend the mathematical foundations of marketing, and can show you meaningful results by the numbers month after month. This holiday season and every season after, Lincoln Digital Group delivers.